EFL student's Toeic test mistake analysis and error tracking system establishment
Project Objectives
Project aims to analyze errors made by a student in TOEIC reading part 5 - 6 to provide insights for performance improvement. By identifying common errors, strategies can be developed to help the student improve their scores.
Analysis Charts and Tools
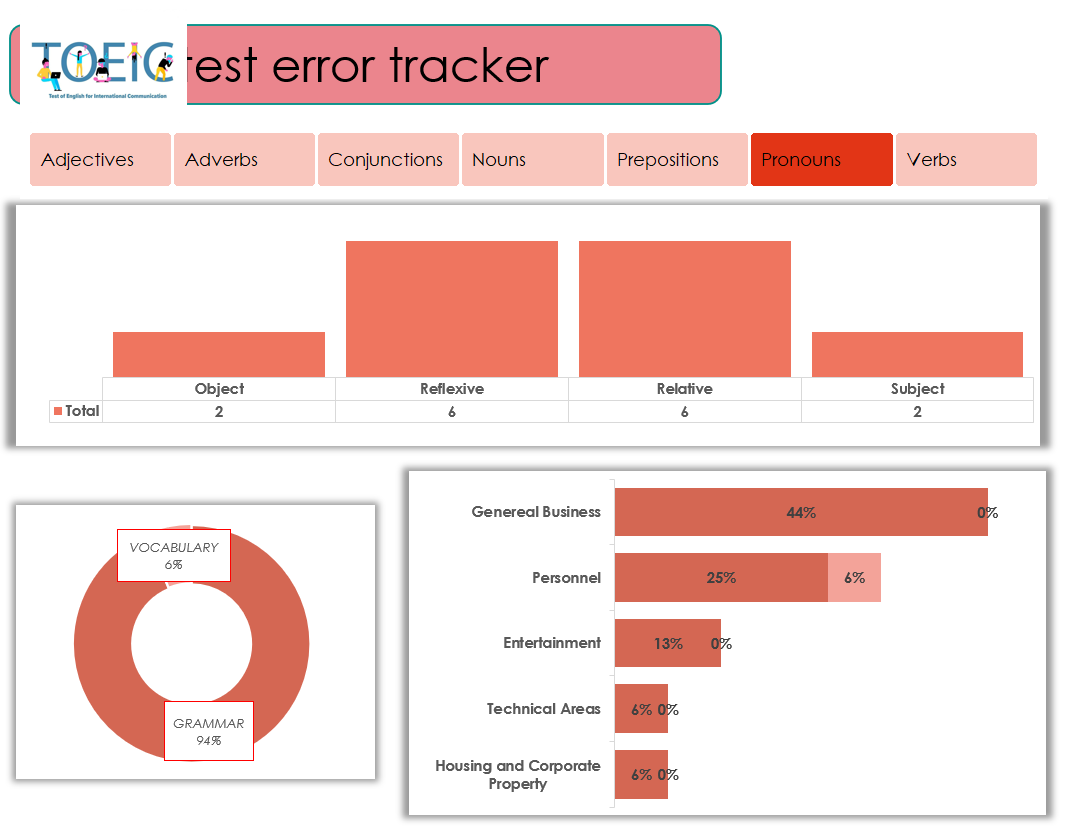
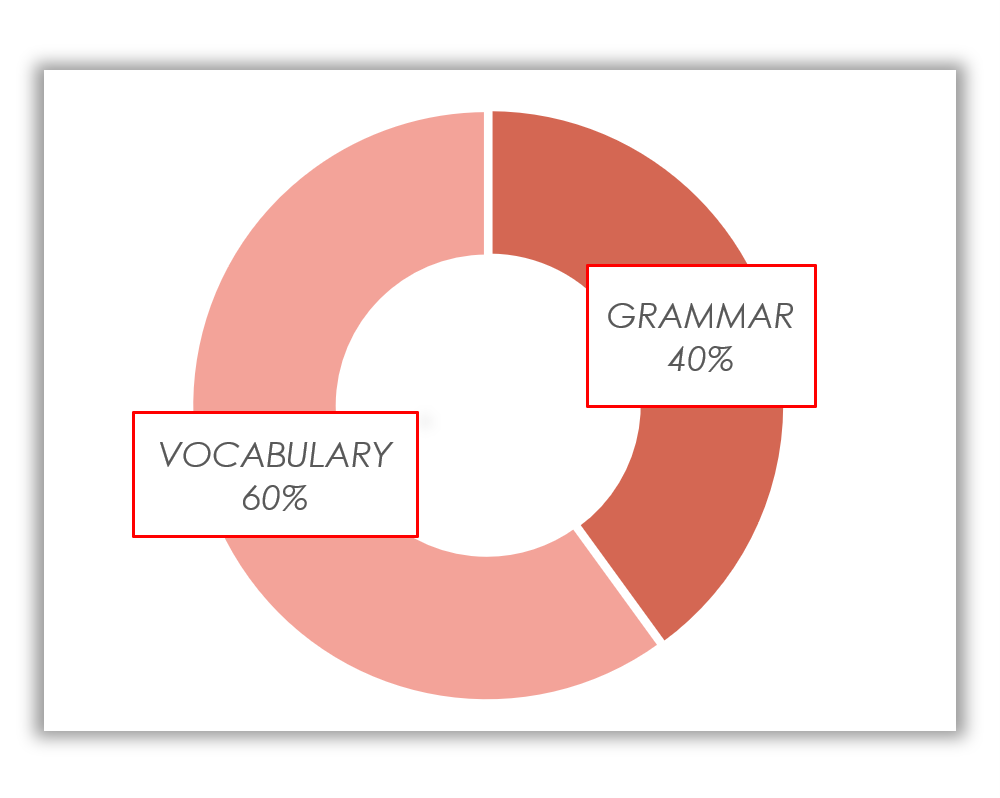
- Donut chart to see error distribution throughout mistake type
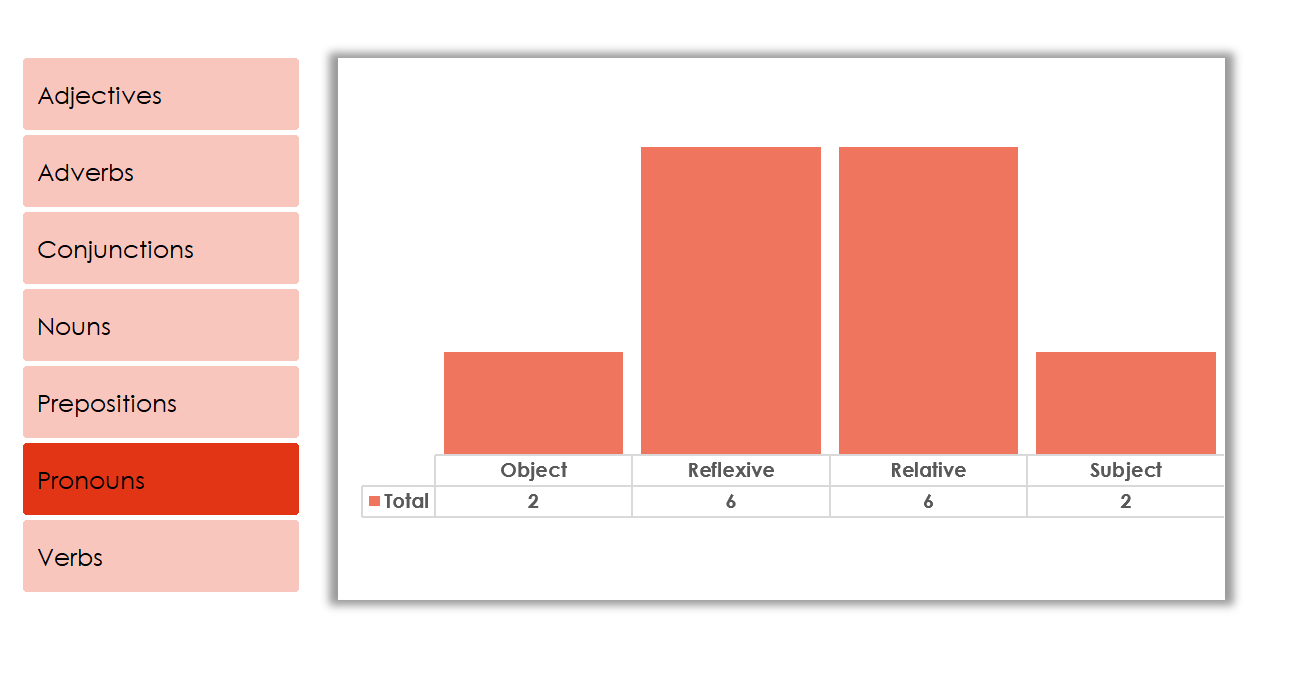
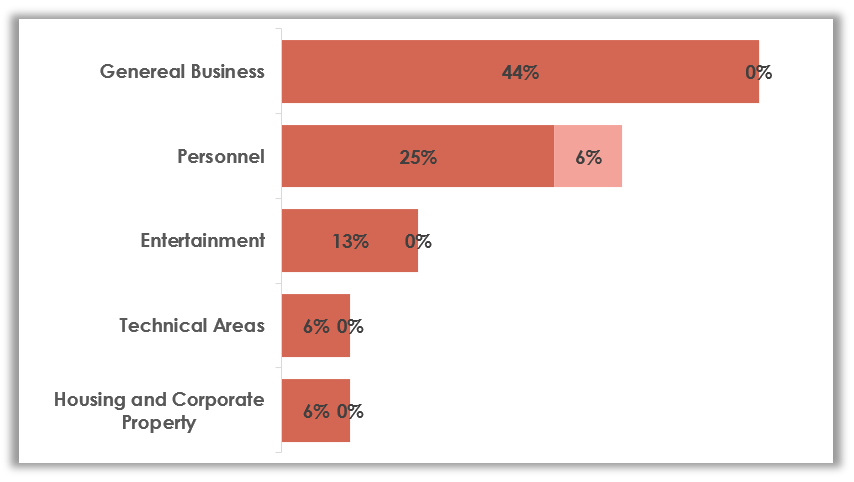
- Column chart to analyze mistake frequency in each topic
- Treemap chart and drill-down function to analyze mistake frequency within part of speech and subtype group
- Card charts to show total mistake count by error type
Data Collection and Preparation
- Collect TOEIC test scores and error data from mock tests
- Organize data in a table with error type, subtype, part of speech, and topic
- Clean and check data for errors such as missing data and outliers
Data Analysis
- Create a pivot table in Excel to summarize data by section and error type.
- Use conditional formatting to highlight common errors.
- Use charts and graphs to visualize data and identify patterns.
- Use Power BI to create interactive dashboards with filters for error type, part of speech, and topic.
Insights and Recommendations
- Develop strategies to address these errors with targeted practice exercises
- Provide feedback to the student on their performance and progress
- Monitor effectiveness of strategies and make adjustments as needed
- Track and update student mistakes using Excel
Project Results
Data Analysis using Excel

Conclusion
The project successfully identified and addressed the errors made by the student in their TOEIC test. Targeted strategies and exercises based on the findings were developed and implemented, resulting in the student's overall performance improvement in subsequent tests. The project will continue to track and analyze the student's mistakes to ensure continued improvement and growth in their English language skills through TOEIC.
In addition to achieving the project goals, the project also provided valuable experience and skills in data analysis. Through the process of data collection, preparation, and analysis, the use of Excel and Power BI to manage and analyze data was effectively demonstrated. The use of pivot tables, charts, graphs, and dashboard visualizations to identify patterns and trends was also demonstrated, as well as developing targeted strategies to address specific areas of weakness.